확정적 항암방사선치료를 받은 국소진행성 두경부편평세포암 환자에서 치료반응 평가를 위한 PET/CT의 역할
Role of Post-Treatment 18F-Fluorodeoxyglucose Positron Emission Tomography/Computed Tomography in Patients Receiving Definitive Chemoradiation for Locally Advanced Head and Neck Squamous Cell Carcinomas
Article information

Trans Abstract
Background and Objectives
18F-fluorodeoxyglucose PET/CT scans can be a useful method to detect recurrence. However, its role in locally advanced head and neck squamous cell carcinomas (HNSCCs) patients after definitive chemoradiotherapy (CRT) has not yet been determined. The current study was performed to identify the role of therapeutic response evaluation using PET/CT after definitive CRT.
Subjects and Method
We conducted a retrospective review of patients with locally advanced HNSCCs, and who have undergone definitive CRT from 2009 to 2017 at a single institution. The patients were divided into two groups according to their responses to the treatment (metabolic complete remission [mCR] group or non-mCR group), assessed by PET/CT scans after definitive CRT.
Results
Twenty-eight patients were consecutively enrolled. The most common primary site of cancer was the oropharynx, followed by the oral cavity, hypopharynx, and nasal cavity. The therapeutic response assessed by PET/CT scans was mCR in 14 patients. The median progression- free survival (PFS) was not reached in the mCR group but was 13.3 months for the non-mCR group (p=0.001). The median overall survival was significantly longer for the mCR group (52.5 months) than for the non-mCR group (15.2 months, p=0.002). A multivariate analysis showed PET/CT response and high-sensitivity C-reactive protein (hsCRP) as independent prognostic factors for PFS (mCR: p=0.027; hsCRP: p=0.042) and for the overall survival (mCR: p=0.006; hsCRP: p=0.020).
Conclusion
PET/CT scans after definitive CRT predicted the prognosis in patients with locally advanced HNSCCs. CRP was a prognostic factor affecting the outcomes of treatments.
Introduction
Head and neck squamous cell carcinoma (HNSCC) includes cancers of the oral cavity, oropharynx, hypopharynx, and larynx. Globally, 800000 people are diagnosed with HNSCC annually [1,2]. Locoregional HNSCC is treated with curative intent using multimodal treatments such as surgery, radiation treatment, chemotherapy, or their combinations [1]. In locally advanced HNSCC patients who are not candidates for surgery, combined chemoradiotherapy (CRT) is the mainstay of treatment [3,4]. However, despite multimodal treatment, over 50% of patients with locally advanced HNSCC experience progression or recurrence within 3 years of treatment [5,6]. Providing additional treatment to patients who did not achieve a complete response (CR) after CRT may therefore be an effective therapeutic approach. Thus, accurate response evaluation after CRT is very important. However, due to radiation-induced tissue reactions, such as fibrosis, the response evaluation after CRT is not as simple as response assessment after chemotherapy [7]. Moreover, changes in tumor vascularity or metabolic activity cannot be assessed by the Response Evaluation Criteria in Solid Tumors (RECIST) criteria, which is considered the gold standard for assessing the tumor response after CRT. Studies on complementary modalities, such as CT perfusion, MRI, and PET/CT, are being conducted to improve the accuracy of post-CRT response evaluations [8-11].
PET/CT is a nuclear medicine modality that combines PET and CT. Imaging with 18F-fluorodeoxyglycose (FDG)-PET/CT can evaluate tumors based on biochemical changes and therefore plays an important diagnostic role in oncologic clinical practice [12]. PET/CT after definitive CRT is considered a useful tool for earlier detection of recurrence during routine surveillance [13,14]. PET may also provide a prognostic marker for predicting treatment responses and survival outcomes in locally advanced HNSCC after treatment [14,15].
In previous studies, PET/CT after CRT showed a prognostic value in assessing overall survival (OS) and progressionfree survival (PFS), and was useful in predicting immediate therapeutic failures [16]. However, there is uncertainty about the role of PET/CT after CRT. We therefore determined the efficacy and the role of PET/CT in locally advanced HNSCC patients who received CRT.
Subjects and Methods
Patients and data collection
Patients who were diagnosed with HNSCC and treated with definitive CRT were retrospectively evaluated. Locally advanced HNSCC was defined as HNSCC which cannot be easily removed by surgery including advanced T stage (T3 or greater) or advanced neck lymph node (N2 or greater) without distant metastasis. Patients who were diagnosed with squamous cell carcinoma in cervical lymph nodes from unknown primary sites but presumed to be of head and neck origin were also included. Among patients who received definitive CRT, those who were evaluated with PET/CT scans before and 12 weeks after CRT were evaluated. Clinical factors and treatment outcomes were obtained from medical records. This study was approved by the Institutional Review Boards of Pusan National University Yangsan Hospital (IRB No. 05-2021-186).
Response evaluation
Patients were evaluated for disease status by PET/CT before and 12 weeks after CRT. Response interpretation was evaluated according to Deauville criteria (Table 1). Complete metabolic remission was defined as Deauville scores of 1, 2, or 3 and no or minimal FDG uptake (less than the mediastinal blood pool) or low-grade uptake (less than in the liver). Non-CR was defined as moderate focal uptake (more than in the liver; Deauville score of 4) or intense focal uptake (Deauville score of 5). In most patients, the maximum standardized uptake value (mSUV) was also recorded. Among the patients with a Deauville score of 3, those with a mSUV ≥3.5 were categorized as non-metabolic complete remission (mCR) in this study.

Deauville score
Statistical analysis
PFS was defined as the time from the start of treatment until disease progression or death. OS was defined as the time from the start of treatment until death as a result of any cause. Survival curves of OS and PFS were analyzed by the Kaplan-Meier method and compared using the log-rank test. All reported p-values were two-sided, and p-values <0.05 were considered statistically significant. All calculations were performed using SPSS statistical software for Windows, version 21.0 (IBM Corp., Armonk, NY, USA).
Results
Patient characteristics
Between November 2009 and March 2017, 28 patients were consecutively enrolled in current study. Table 2 shows the patient characteristics. Fourteen patients were assessed as mCR by PET scans 12 weeks after CRT, and 14 patients were evaluated as non-mCR. The majority of patients were stage IV without distant metastases. Four patients underwent induction chemotherapy before CRT and most patients received CRT with a cisplatin-based regimen (Table 2).
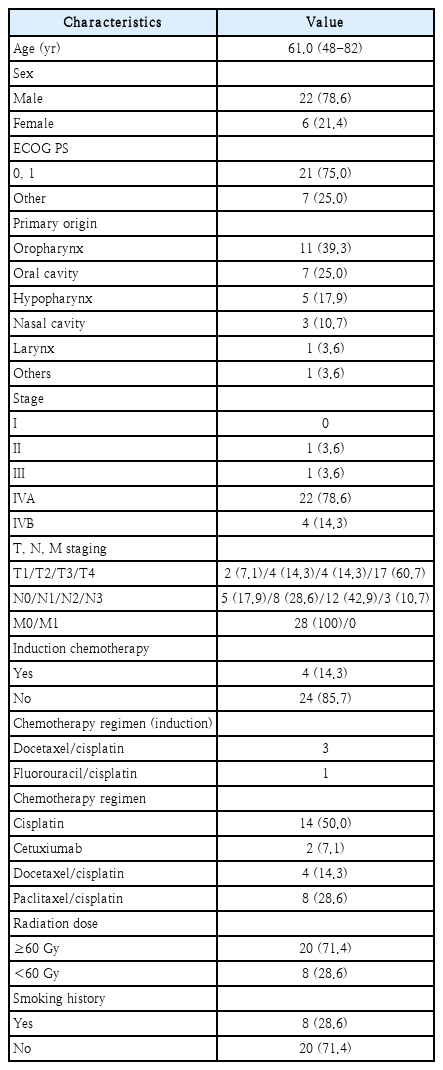
Patient characteristics (n=28)
Response and survival
When assessing disease status after CRT, 11 patients achieved mCR and 17 patients did not achieve mCR. Patients of larynx and unknown origin were all mCR and 45.5% of oropharyngeal origin patients achieved mCR (Table 3). In 11 patients who achieved mCR, CT or MRI results did not show CR with PET/CT in 4 patients (PR in 2 patients, SD in 1 patient). In non-mCR group, 12 patients showed PR and 5 patients showed SD in CT or MRI. The median follow-up was 34.2 (2.6-140.5) months. In all patients, the median PFS was 19.8 (95% confidence interval [CI]: 10.7-28.9) months and the median OS was 34.8 (95% CI: 26.7-42.8) months. The median PFSs in the mCR was not reached and median PFS in the non-mCR groups was 13.3 (95% CI: 6.0-20.6) months. The median OS in the mCR group and non-mCR group were 52.5 (95% CI: 0-144.4) and 15.2 (95% CI: 10.9-19.5) months, respectively. The PFS and OS were longer in the mCR group and had a better statistical significance than the non-mCR group (Table 4 and Fig. 1).

Response according to primary origin

PFS and OS according to PET/CT responses after definitive chemoradiotherapy

Kaplan-Meier survival analysis of PFS (A) and OS (B) according to the PET/CT response, and mCR versus non-mCR. Both PFS and OS were significantly longer in patients with a mCR response using post-treatment PET/CT (p=0.001 for PFS, p=0.002 for OS; logrank test). PFS, progression-free survival; OS, overall survival; mCR, metabolic complete remission.
Univariate and multivariate analyses
In the univariate analyses for PFS, the following were not significant factors: age, sex, Eastern Cooperative Oncology Group Performance Status, cancer stage, smoking history, tumor differentiation, weight loss during CRT, neutrophil to lymphocyte ratio (NLR), and radiation dose. Diabetes (p=0.034), high-sensitivity C-reactive protein (hsCRP) (≤1.0 vs. >1.0, p=0.017), and PET/CT response were significant factors for PFS. In multivariate analysis for PFS, hsCRP measured before treatment (p=0.042) and response by PET/CT after CRT (p=0.027) were independent prognostic factors (Table 5). In univariate analyses for OS, hsCRP, NLR, and PET/CT responses were significant factors. In multivariate analysis, hsCRP (p=0.020) and PET/CT responses (p=0.006) were independent prognostic factors for OS, similar to the results for PFS.
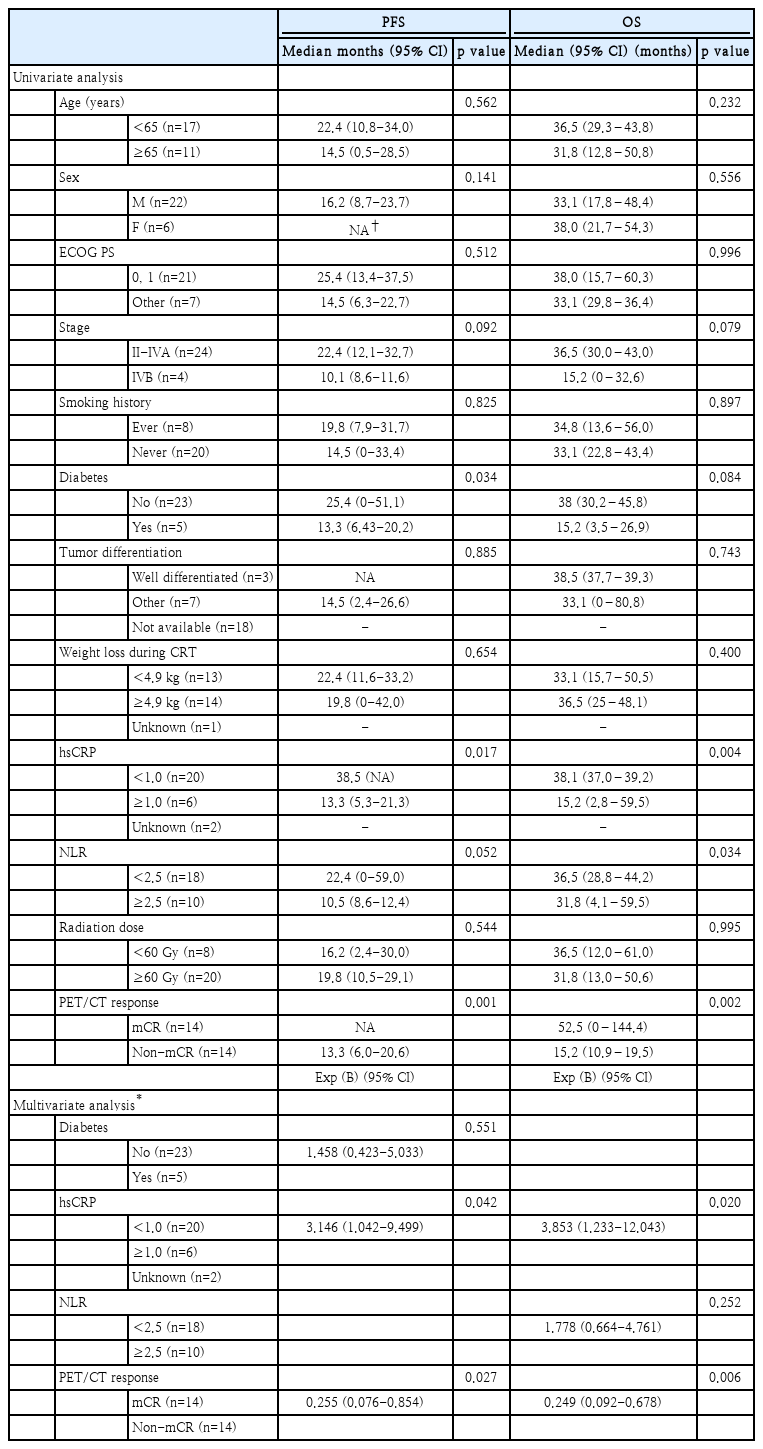
Univariate and multivariate analysis of PFS and OS (n=28)
Discussion
In patients with locally advanced HNSCC, multimodal treatment, including surgery, radiation therapy, and chemotherapy, is the most important treatment strategy. When surgery is not possible, definitive CRT is the standard treatment. For several disease sites, such as the nasopharynx or p16-positive oropharynx, CRT has replaced surgery and has been established as a standard treatment modality for decades [17-19]. Despite multimodality treatment, over 50% of locally advanced HNSCC patients who received treatments unfortunately experience progression or recurrence within 3 years [5,14,20]. It is therefore important to classify and evaluate patients with a high risk of progression after CRT. Various factors including initial tumor stage, primary tumor location, HPV status, and smoking history can be prognostic factors for progression or recurrence [21]. In addition, other predictive markers that may help for surveillance are being widely investigated [9,22-25]. Morphological assessment of the involved lesion is the standard method for tumor response evaluation. The original RECIST criteria and the revised version (v.1.1) have been widely used to assess the treatment responses of solid tumors [26,27]. RECIST can be easily used because it is based on the longest diameter of the measurable lesion, but it can also be a disadvantage when size is a criterion. Due to reactive changes, such as inflammatory reactions and fibrosis, after CRT, morphological evaluation has limitations in evaluating residual cancers. To overcome this disadvantage of morphological imaging, functional imaging methods have been extensively investigated [8-10,28,29]. Recently, morphological and functional evaluations have been shown to complement each other, so evaluating both the morphological and functional status of tumors has been accepted as the optimal evaluation method for treatment decisions [20,29]. PET/CT is a representative functional imaging modality that has been to evaluate the metabolic activities of tumors in patients with malignancies. PET/CT provides sequential images from both PET and CT scans, which can show metabolic activity correlated with anatomical location. In locally advanced HNSCCs patients who received CRT, PET/CT is widely used to evaluate the status of residual tumors. Several previous studies suggested the important role of PET/CT in locally advanced HNSCCs patients [6,15,16]. Based on these and other studies, PET/CT has become an essential imaging tool in patients with locally advanced HNSCCs who received CRT for response evaluation and prognoses [9,11,20,30].
Many criteria have been investigated in the interpretation of PET/CT images [9]. The SUV number for several years has already been considered inappropriate as a criterion for judging residual disease after CRT [31,32]. Since the 2010s, four popular semi-quantitative evaluation criteria have been reported and validated [33-36]. In a recent comparative study, four criteria showed similar diagnostic performance characteristics [37]. Thus, any one criterion has not yet become the gold standard for PET/CT interpretation. In the present study, we used the Deauville score, but for the indeterminate score (score 3), we additionally used mSUV for more accurate statistical analyses. We then investigated the prognostic role of PET/CT in patients with locally advanced HNSCCs who received CRT. PET/CT was conducted before and approximately 12 weeks after CRT. Patients with mCR after CRT showed significantly longer PFS, and the OS was also significantly found to be longer in patients with mCR after CRT. The median OSs in patients with mCR and non-mCR were 52.5 months and 15.2 months, respectively. Using univariate and multivariate analyses, the PET/CT response of mCR after CRT was an independent prognostic factor for PFS (hazard ratio [HR]: 0.255, 95% CI: 0.076-0.854) and OS (HR: 0.249, 95% CI: 0.092-0.678). In addition, the hsCRP level before CRT was another significant prognostic factor for PFS and OS. This might be because high level of hsCRP may reflect initial high tumor burden. The results of our study were consistent with that of previous studies, which showed that PET/CT was helpful in predicting the prognosis after CRT.
Current study had several limitations due to its retrospective design and small sample size. The primary tumor site and chemotherapy regimen during CRT were heterogeneous. The number of patients was small in current study. By using an extended follow-up period, we overcame the disadvantage of small sample size and showed a statistically significant difference between the mCR and non-mCR groups. The results of this study were obtained from clinical practices, so it is meaningful that PET/CT results, which is widely used in clinics, provided a prognostic marker after CRT. However, further prospective large-scale studies will be needed to confirm the results.
In conclusion, PET/CT scans predicted the outcomes in locally advanced HNSCCs patients who received definitive CRT, and hsCRP was also a prognostic factor for treatment outcomes.
Acknowledgements
None
Notes
Author Contribution
Conceptualization: Jae-Joon Kim, So Yeon Oh. Data curation: Sang-Bo Oh, Ki Sun Jung, Kwonoh Park. Formal analysis: Seong- Jang Kim, Yongkan Ki, Jin-Choon Lee. Writing—original draft: Jae-Joon Kim, So Yeon Oh. Writing—review & editing: all authors.