국소적으로 진행된 분화갑상선암의 유전적 분석: 임상적 가치
Genetic Analysis of Locally Advanced Well-Differentiated Thyroid Cancer: Clinical Prognostic Implications
Article information

Trans Abstract
Background and Objectives
Despite the usually favorable prognosis of well-differentiated thyroid cancer (WDTC) following appropriate treatment, advanced T-staged WDTCs are associated with poor prognosis. This study focused on identifying genes associated with the prognosis of locally advanced WDTC by analyzing a The Cancer Genome Atlas cohort.
Subjects and Method
We analyzed the data of 501 patients with WDTC and classified them into two subgroups: pathological T4 stage (Cluster 1) or T1-3 stage (Cluster 2). We compared the mRNA expressions of thyroid cancer-related genes, and the somatic mutation frequencies of various cancer genes between the two subgroups.
Results
Cluster 1 included 23 patients (papillary=21/follicular-variant papillary thyroid cancer [FVPTC]=2) and Cluster 2 478 patients (papillary=371/FVPTC=100/others=7). Cluster 1 showed worse overall and disease-free survival than Cluster 2 (p<0.05 and p=0.12, respectively). Patients with pT4 stage had about a 1.8-fold increased risk of overall recurrence or death. MET, SERPINA1, TIMP1, PROS1, FN1, CDKN2A, and CDKN2B were significantly elevated while TG, DNAH9, TFF3, CRABP1, TPO, JAK2, KIT, KDR, and NFE2L2 were significantly lower in Cluster 1 (all, p<0.05 and adjusted p<0.05). A TERT, EIF1AX, and ATM showed significantly frequent somatic mutations in Cluster 1 when compared to Cluster 2. We also identified seven pathways related to 16 genetic markers.
Conclusion
Locally advanced WDTC presented 16 genetic alterations. We identified somatic mutations associated with local invasion transformation. Relevant pathways related to the 16 genetic markers could be therapeutic targets. Genetic analysis of locally advanced WDTC may be used to predict clinical applications in patient survival.
Introduction
Resectable well-differentiated thyroid cancers (WDTC), including papillary thyroid cancer (PTC) and follicular-variant PTC (FVPTC), have a favorable prognosis after surgical treatment with or without adjuvant radioactive iodine therapy (RAI). WDTC treatment results are affected by age, gender, aggressive subtypes, and various molecular markers [1]. About 10% of WDTC are composed of locally advanced and resectable WDTC (T4a) invading surrounding structures [2]. These have double the recurrence rate of a lower staged WDTC, and about 30% of patients with advanced thyroid cancer died within a decade [3]. Among patients with distant metastasis, T4-staged tumors increased the risk of distant metastasis and decreased recurrence-free survival rate by five compared to early staged WDTC [4]. Compared to confined diseases, locally advanced WDTC requires adjuvant RAI, which reduces the risk of recurrence/disease-specific mortality in high-risk patients. External beam radiation therapy (EBRT) is also used to control local recurrence or residual tumors after surgical resection. Despite these treatment modalities, the five-year disease-specific survival rate of T4-staged WDTC is between 67.9%-87.6%, depending on the resection margin status [5]. Targeted therapy-based on a molecular biomarker investigation may improve treatment outcomes in locally advanced WDTC.
Most WDTC are associated with alterations in a limited number of driver genes, including point mutations in the BRAF or RAS genes or rearrangements of RET/PTC or PAX8/PPARγ, which activate the receptor tyrosine kinase/mitogenactivated protein kinase (MAPK) pathway [6]. Accumulated genetic and epigenetic alterations initiate and progress thyroid cancer.
A pan-cancer study using The Cancer Genome Atlas (TCGA) defined genetic alterations in PTC with a focus on low-to-intermediate risk tumors [7]. Previous studies have demonstrated the potential contribution of TERT and various oncogenes (AKT1/PIK3CA and EIF1AX) in the early progression of WDTC. In particular, they report that loss of CDKN2A may be a strong prognostic factor for patients with advanced WDTC [8]. Although the molecular characteristics of WDTC have been analyzed, the underlying mechanism of its progression to locally advanced and resectable WDTC has not been fully elucidated. To overcome the limitations of current treatments for advanced thyroid cancer, the genetic landscape suggests molecular diagnosis and treatment tools. In this study, we focused on analyzing the TCGA cohort to identify the genes related to locally advanced WDTC. We evaluated the associations between genetic markers and the prognosis of patients with advanced WDTC.
Subjects and Methods
Data sources
We collected clinical and genomic data from TCGA thyroid carcinoma. These data can be downloaded from the cBioPortal Browser (https://cbioportal.org/). Clinical information included age, sex, tumor site, TNM staging, recurrence, and survival outcomes. We generated gene expression data for the TCGA cohort by Illumina HiSeq 2000 (Illumina, Inc., San Diege, CA, USA) RNA sequencing Version 2 Analysis and transformed and mapped log2-via RSEM [9]. We summarized how the data source was used for data collection in Fig. 1 schematic diagram. There were a total of four cohorts in the cBio-Portal thyroid study, three of which were WDTC cohorts. The first large-scale integrative genomic analysis of WDTC took place in 2014 (TCGA, Cell 2014). We selected the cohort with the most T4 stage patients (TCGA, Firehose Legacy). Finally, the selected cohort (n=501) included 392 cases of PTC, 102 cases of FVPTC, and seven others. We divided the enrolled patients into Cluster 1 (T4) and Cluster 2 (T1, T2, and T3) according to pathological T classification.
Flow diagram of the study selection process.
Variety of genes associated with thyroid cancer
Griffith, et al. [10] identified 12 important diagnostic biomarkers through a meta-review of gene expression in thyroid cancer. Pozdeyev, et al. [11] proposed an updated model of the genetic evolution of thyroid cancer.
Pathway analysis
We used the functional annotation tools from the Database for Annotation, Visualization, and Integrated Discovery (DAVID) bioinformatics resources 6.8 [12]. We used the default setting from the tool to map the 16 gene lists to the reference set of direct and indirect relationships, which is a differentially expressed gene list between the two subgroups. p-values were adjusted for multiple testing using the Benjamini-Hochberg procedure within the dataset and the Kyoto Encyclopedia of Genes and Genomes (KEGG) pathway module. Significant results were constrained at the 0.05 level after adjustment for multiple testing corrections.
Statistical analysis
To test the prognostic significance, we used only gene expression information with available survival data. Overall survival (OS) was defined as the day of surgery to death due to any cause or the last visit. The disease-free survival (DFS) was defined as the day of surgery to the first recurrence at any site or the last visit. Prognostic significance between the two subgroups was estimated by the Kaplan-Meier method. Univariate and multivariate binary logistic regression analyses were used to identify factors associated with survival and recurrence. Univariate Cox proportional hazards regression analyses were used to identify associations between variables and OS or DFS. Significant variables in the univariate analyses with p-values of <0.05 were included in multivariate analyses. Hazard ratios and 95% confidence intervals (CIs) were estimated.
Fisher’s exact test was used to assess the frequency difference of driver genes, and included an adjusted p-value (Benjamini Hochberg method) from statistical analysis to inform the potentially differentially expressed error detection rates between the two subgroups. p-values of less than 0.05 were considered statistically significant and all statistical tests were two-tailed. Statistical analyses were performed using the IBM SPSS Statistics version 24.0 for Windows (IBM Corp., Armonk, NY, USA) and R package version 3.4.4 (http://www.rproject.org).
Results
Cohort characteristics
The 501 patients included 135 (26.9%) males and 366 (73.1%) females with a median age of 46 years (range, 15-89 years). Cohort characteristics are summarized in Table 1. The most common tumor site was the right lobe (n=214, 42.7%), followed by the left lobe (n=173, 34.5%), bilateral (n=86, 17.2%), isthmus (n=22, 4.4%), and others (n=6, 1.2%). Advanced T classification was found in 192 patients included T3 and T4 (38.3%), nodal positivity in 225 patients included N1a and N1b (44.9%), and there was an overall III-IV stage in 165 patients (33.0%). The most common histological finding was the papillary (n=392, 78.2%), followed by the FVPTC (n=102, 20.4%), and others (n=7, 1.4%).
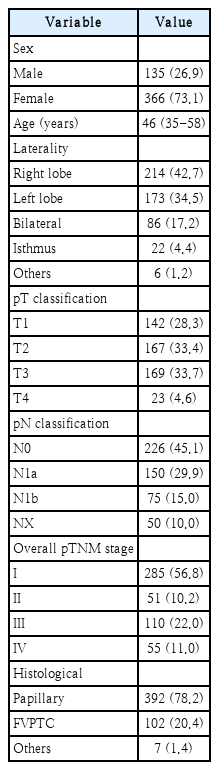
Patient characteristics (n=501)
Survival outcome of Cluster 1 and Cluster 2
Cluster 1 and Cluster 2 consisted of 23 patients (papillary=21/FVPTC=2) and 478 patients (papillary=371/FVPTC=100/others=7), respectively. The Kaplan-Meier plots showed that the OS of Cluster 1 was significantly worse than Cluster 2 (p< 0.05) (Fig. 2A). Five-year OS rates of Cluster 1 and Cluster 2 were 78.2% (95% CI, 75.9%-81.5%) and 98.3% (97.8%-99.2%), respectively (p<0.05). The DFS of patients in Cluster 1 was worse than that of patients in the Cluster 2 subgroup (p=0.12) (Fig. 2B). The five-year DFS rates of Cluster 1 and Cluster 2 were 83.3% (79.6%-86.8%) and 91.2% (88.7%-94.3%), respectively (p=0.12). Fig. 2 represents the Kaplan-Meier estimates for T4 stage and other stage patients in WDTC.
Kaplan-Meier curves estimating survival according to pathological T4 classification and T1-3 classification. Overall survival (OS), and disease-free survival (DFS) between two subgroups. Log-rank test, p<0.05.
Variables for survival
Univariable analyses showed that age (≥55 years), overall pTNM (III-IV) stage, and Cluster 1 were significantly associated with OS outcomes (all p<0.05). Additionally, overall pTNM (III-IV) stage was significantly associated with DFS outcomes (p<0.05) (Table 2). In multivariate analyses, Cluster 1 remained strongly associated with OS and DFS outcomes (p<0.05) (Table 3). Age (≥55 years) also remained the independent factors of OS but not DFS (p<0.001). Patients with pT4 stage had about a 1.8-fold increased risk of overall recurrence or death.
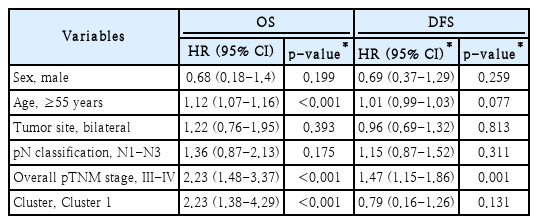
Univariable analyses of factors in association with OS and DFS

Multivariable analyses of variables in association with DFS and OS
Discovery of sixteen related genes in locally advanced WDTC
This study analyzed the expression of a variety of genes associated with thyroid cancer, including BRAFV600E, RAS, RET, and ALK, between two clusters. In Cluster 1, expression of MET, SERPINA1, TIMP1, PROS1, FN1, CDKN2A, and CDKN2B was significantly elevated (all, p<0.05) (Supplementary Fig. 1A), while expression of TG, DNAH9, TFF3, CRABP1, TPO, JAK2, KIT, KDR, and NFE2L2 was significantly lower compared with Cluster 2 (all, p<0.05) (Supplementary Fig. 1B and Supplementary Table 1).
Relationship between clusters and somatic mutation
We analyzed the data of patients in the TCGA cohort (n=501) to investigate the somatic mutations between the two clusters in WDTC. The current study identified the incidence of somatic mutation in BRAFV600E at 59.8%, which is similar to the TCGA cohort (58.0%) in 2014, whereas only 8.4%, 3.5%, and 0.7% of tumors had RAS mutations (NRAS, HRAS, and KRAS, respectively) (Fig. 3 and Supplementary Table 2). The signaling pathways and gene groups seen more frequently in advanced differentiated thyroid cancers (DTCs) are tumor suppressors, the cell-cycle pathway, and the PI3K/AKT pathway [11]. Among these genes, A TERT, EIF1AX, and ATM showed a significantly higher frequency of somatic mutation in Cluster 1 than in Cluster 2 (Fig. 3 and Supplementary Table 2). There was no difference in the frequency of somatic mutations between the two subgroups for BRAFV600E and NRAS.

Somatic mutation between two clusters of patients in the The Cancer Genome Atlas cohorts. Samples are shown in columns and are cluster according to T classification.
Pathway analysis
The genes analyzed with the DAVID functional annotation tools identified seven significant KEGG pathways based on mutational enrichment (Table 4): proteogloycans in cancer (p=0.053), the Rap1 signaling pathway (p=0.058), and autoimmune thyroid disease (p=0.094). Moreover, several pathways important for locally advanced cancer were identified, including the PI3K-AKT signaling pathway (p=0.003), the pathway in cancer (p=0.005), focal adhesions (p=0.056), and the Ras signaling pathway (p=0.066).

The significant KEGG pathways
Discussion
In this study, we demonstrated that the genetic profile of T4 staged WDTC has genetic alterations, somatic mutations, and a relevant pathway compared to the less aggressive WDTC by analyzing a TCGA cohort. Patients were classified into two subgroups of pathological T4 stage or T1-3 stage (Cluster 1 and Cluster 2, respectively). The OS and DFS differences between subgroups were compared. Patients with pT4 stage had about a 1.8-fold increased risk of overall recurrence or death. T4 staged WDTC presented 16 genetic alterations compared to less aggressive thyroid cancers, and we identified somatic mutations associated with locally invasion transformations. We also identified seven pathways related to 16 genetic markers. We enhanced the current knowledge about the genetic characteristics of locally advanced and resectable WDTC.
WDTC, such as follicular and papillary carcinomas, account for 95% of all thyroid cancer cases and are generally have a survival rate of almost 100% when diagnosed early [13]. Approximately 25% of patients with WDTC develop locally advanced or metastatic disease. Locally advanced WDTC is managed differently with adjuvant therapy and surgical treatment [14]. Post-surgical management includes RAI therapy to reduce these locoregional and distant metastasis. When RAI therapy becomes ineffective against DTC, the five-year survival is <50% and 10-year survival is <10% [15]. Of 80 patients with radioactive iodine-refractory DTC, 38 had somatic mutations (47.5%), including BRAFV600E, RAS, TP53, MET, PIK3CA, GNAS, and TPO [16]. The first TCGA cohort discovered two molecular subtypes, BRAFV600E-like and RAS-like, in the papillary thyroid carcinoma [7]. Dedifferentiation is likely to play a role in mitigating responses to RAI treatment and is consistent with the BRAF mutation [17]. However, our results showed no difference in the BRAF mRNA expression level and the frequency of somatic mutations between the two clusters.
In our study, 23 patients with pathological T4 classification had significantly elevated expression of CDKN2A and significantly lower JAK2 compared with Cluster 2. Expression of BRAF, RAS, RET, and ALK did not differ between the two subgroups. CDKN2A and CDKN2B are negative cell-cycle regulators, and their loss due to copy number alterations, inactivating mutations, or epigenetic silencing is one of the most frequently encountered genetic events in human cancer [18]. In thyroid cancer, genetic alterations of CDKN2A and CDKN2B were seen more frequently in anaplastic thyroid cancer compared with PTC, suggesting a potential role in anaplastic transformation [11]. The prognostic significance of JAK2 has been well described for a variety of cancers, but not advanced thyroid cancer. JAK2 plays a critical role in the signaling of prolactin hormone, which may be involved in the development of medullary thyroid carcinoma. Peng, et al. [19] examined the TCGA database containing 9315 tumor samples from 31 cancer types to study the relationship between the mRNA expression of JAK2 and PD-L1 expression. They found that high JAK2 expression was associated with high mRNA expression of PD-L1, which is likely a good indicator for immunotherapy response, including anti-PD-1/PD-L1 therapy. Our results of significantly lower JAK2 expression in Cluster 1 compared to Cluster 2 may contribute to a treatment strategy that can screen patient populations that may benefit from immunotherapy.
A recent study identified 676 genes associated with an increased risk of PTC recurrence in TCGA data [20]. Chien, et al. [20] demonstrated that the downregulation of the sodium-iodide symporter SLC5A5 was the strongest predictor of a decreased recurrence-free survival. Our study and previous studies have shown the associations of KIT, TFF3, and TG low with increased recurrence rates. Most of the recently discovered targeted therapies inhibit the known oncogenic mechanisms in thyroid cancer initiation and progression, such as the MAPK pathway, PI3K/Akt-mTOR pathways, or VEGF [21]. In clinical trials using trametinib with VEGF inhibitors in advanced DTC patients, 33% of subjects showed a partial response and 50% had stable disease [22]. Bible, et al. [23] reported significant activity of single-agent VEGF inhibitor in progressive RAI refractory DTC, with an overall confirmed PR rate of 49%.
We evaluated genes reportedly altered more frequently in advanced differentiated and anaplastic thyroid cancer than in DTC [24]. The present study revealed that mutations of TERT, EIF1AX, and ATM were found more frequently in Cluster 1 than Cluster 2. The TERT gene locus was amplified in various cancers, including lung, breast, and cervical cancer [25], and the prevalence of TERT promoter mutations in thyroid cancer was more frequent in poorly differentiated and anaplastic thyroid cancers [26]. A recent study identified an EIF1AX mutation in a nodule ultimately diagnosed as oncocytic thyroid carcinoma [27]. EIF1AX mutations are predictive of worse survival in WDTC [28]. This suggests that the treatment strategy can be predicted by markers found in advanced WDTC, unlike the mutations that are the major drivers of WDTC.
Table 4 shows the KEGG pathways of our 16 genes. Previous studies using NGS in WDTC usually evaluated the diagnostic efficacy of mutation detection in thyroid cancers. In addition to mutation detection such as TP53 and TSHR, chrmomosomal rearrangements, including RET/PTC and PAX8/PPARγ, presented a diagnostic role. In this study, we aimed to find the prognostic value of the mutations in WDTC from the diagnosis. However, the lack of chromosomal rearrangement data in the TCGA cohort is a limitation of this study, and further prognostic factors may be found if research on chromosomal rearrangement is conducted in the future. A growing body of evidence demonstrating the involvement of the PI3KAKT signaling pathway in thyroid carcinogenesis and drug resistance led to the discovery of several agents targeting key members of this cascade [21]. Multi-kinase inhibitors targeting highly expressed tyrosine kinases in thyroid cancer cells demonstrate a promising anti-tumor activity in vitro and in vivo [29]. The few targeted therapies that have been proven effective for advanced WDTC, including sorafenib, selumetinib, pazopanib, and sunitinib, have promising results. Due to its high affinity to the VEGF receptor, lenvatinib showed high antiangiogenic effects in the thyroid cancer mouse model [30].
This study has some limitations. High post-ablation stimulated thyroglobulin level (≥1 ng/mL) and macroscopic ETE were reported as negative prognostic factors in T4a staged WDTC. It is difficult to consider these clinical and pathological factors using TCGA data. Specific clinical factors may help delineate the genomic landscape related to aggressive tumor behavior. Another limitation of this study included not controlling for histologic variants or tumor nodal positive of the well that are differentiated for the thyroid cancer studied. Our study aimed at identifying related genes and somatic mutations instead of developing a validated prognostic factor in locally advanced WDTC. We hypothesized that using pathway analysis would provide a better understanding of the thyroid carcinogenesis involved in T4 stage tumors.
In conclusions, a refined classification system that more accurately reflects genotypic and phenotypic differences between locally advanced and resectable WDTC (T4a), which invade the surrounding structures, and other WDTCs will lead to more precise medical and surgical treatment. Our study provides insight into the molecular pathogenesis of T4 beyond its histological classification. Relevant pathways could be possible therapy targets. Further studies are necessary to determine the clinical applications of this work in the treatment of T4 staged WDTC.
Supplementary Material
The Data Supplement is available with this article at https://doi.org/10.3342/kjorl-hns.2023.00178.
Acknowledgements
This research was funded by the National Research Foundation of Korea, grant numbers MSIP; 2016R1C1B1014827 and 2019R1H1A1080141 to Y.S.L.
The collection of data that supports the findings in this study is available from the cBioPortal Browser (https://cbioportal.org/). Data are available from the authors upon reasonable request and with permission of The Cancer Genome Atlas (TCGA) thyroid carcinoma.
Notes
Author contributions
Conceptualization: Ah Ra Jung. Data curation: Ah Ra Jung. Formal analysis: Ah Ra Jung. Funding acquisition: Yoon Se Lee. Investigation: Yoon Se Lee. Methodology: Ah Ra Jung. Project administration: Ah Ra Jung, Yoon Se Lee. Resources: Sun Seong Kang, Seung Yeon Jeon. Supervision: Yoon Se Lee. Validation: Ah Ra Jung, Yoon Se Lee. Visualization: Sun Seong Kang, Seung Yeon Jeon. Writing—original draft: Ah Ra Jung, Sun Seong Kang, Seung Yeon Jeon. Writing—review & editing: Ah Ra Jung, Yoon Se Lee.