Correlation Between Keros Classification and the Location of the Anterior Ethmoidal Artery: A CT-Based Study
Keros 분류와 전사골동맥 위치 간의 상관관계: CT 영상 기반 분석
Article information

Abstract
Background and Objectives
The lateral lamella of the cribriform plate (LL) at the ethmoid roof is the most vulnerable site for skull base (SB) injury during endoscopic sinus surgery (ESS). The Keros (K) classification is widely used as a radiologic index to estimate the risk of SB injury. This study aimed to quantitatively evaluate the relationships among the K classification, LL, and the position of the anterior ethmoidal artery (AEA), including the SB-AEA distance and AEA type, in order to assess their clinical relevance for improving ESS safety.
Subjects and Method
This retrospective study analyzed sinus CT of 294 patients (588 sides). The K classification (types I, II, and III), LL length, and the distance between the SB and AEA (SB-AEA) were measured. The AEA location was classified either as type 1 (located at the SB) or type 2 (low-lying, below the SB).
Results
The K type II was the most common classification. A significant association was identified between the K classification and the prevalence of AEA type 2 (p<0.001). The SB-AEA distance differed significantly among the different K types (p<0.001), with the K type III demonstrating the greatest distance (2.75±1.86 mm), which was significantly longer than that of types I and II. The LL length showed a significant positive correlation with the SB-AEA distance (r=0.323, p<0.001).
Conclusion
The K type III represents an anatomical configuration that may be more susceptible to the AEA injury than other K types, characterized by a greater SB-AEA distance and a higher prevalence of low-lying AEA.
Introduction
Endoscopic sinus surgery (ESS) has become an established standard treatment for chronic rhinosinusitis that is refractory to medical therapy or that recurs after such treatment. However, ESS carries a risk of serious complications, including skull base (SB) and orbital injuries. The lateral lamella of the cribriform plate (LL) in the ethmoid roof is the site most vulnerable to SB injury during ESS [1-3]. In particular, the LL is the thinnest and most variable portion of the ethmoid roof and is therefore at the greatest risk of intraoperative perforation [1,4].
To predict the risk of SB injury, Keros [1] proposed a classification system based on the height difference between the cribriform plate and the lateral ethmoid roof. The Keros (K) classification is divided into type I (1-3 mm), type II (4-7 mm), and type III (8-16 mm). Type III is associated with a longer LL, greater structural vulnerability, and a higher risk of SB injury [1].
The anterior ethmoidal artery (AEA) arises from the ophthalmic artery, passes through the anterior ethmoidal foramen in the medial orbital wall, and courses along or below the ethmoid roof [5,6]. The AEA is often located below the SB, a low-lying position that increases the risk of surgical exposure and injury [7,8]. Therefore, quantitative preoperative assessment of AEA location is essential for improving the safety of ESS [9,10].
To our knowledge, this is the first single-center study in a Korean population to quantitatively evaluate the associations among K type, LL length, SB-AEA distance, and AEA type using paranasal sinus computed tomography (CT). In addition, we aimed to compare our findings with those of previous international studies [11-14].
Subjects and Methods
Subjects
This retrospective study included patients who visited our hospital with symptoms of rhinosinusitis and underwent paranasal sinus CT. The study period was from July 2017 to December 2018. A total of 294 patients aged 18 to 70 years were included in the final analysis, corresponding to 588 sides when both the left and right sides were analyzed.
Patients were included if they presented with sinonasal symptoms, including nasal obstruction, purulent rhinorrhea, postnasal drip, headache, facial pain, and olfactory dysfunction, and underwent paranasal sinus CT. The exclusion criteria were the presence of lesions that could interfere with radiologic measurements, such as tumorous or mucocele-like lesions, and a history of previous nasal surgery or facial fracture. This study was approved by the Institutional Review Board of Wonkwang University Hospital with approval number 2026-01-020.
Radiologic measurements
Paranasal sinus CT
Paranasal sinus CT images of the 294 study subjects were obtained using a Somatom Definition Flash 256-slice CT scanner (Siemens Healthineers). Axial images were acquired at a thickness of 1 mm, and coronal and sagittal images were reconstructed at a thickness of 2 mm using a Wizard workstation (Siemens Healthineers). Measurements on CT images were performed by two otolaryngology residents. The following procedures were used to minimize measurement error. First, before the measurements for this study, the investigators thoroughly reviewed the measurement methods used in previous studies. Second, the two residents reviewed the measurement protocol with the corresponding author on multiple occasions. Third, when uncertainty arose during measurement, the corresponding author and the two residents reached a consensus decision after joint review.
K classification and LL measurement
The K classification is based on the LL. Measurements were performed according to the method of Koo, et al. [15]. Among the coronal CT images, the image in which the crista galli was most clearly visualized was selected. The vertical distance between the horizontal line of the fovea ethmoidalis and the horizontal line of the cribriform plate was then measured (Fig. 1).
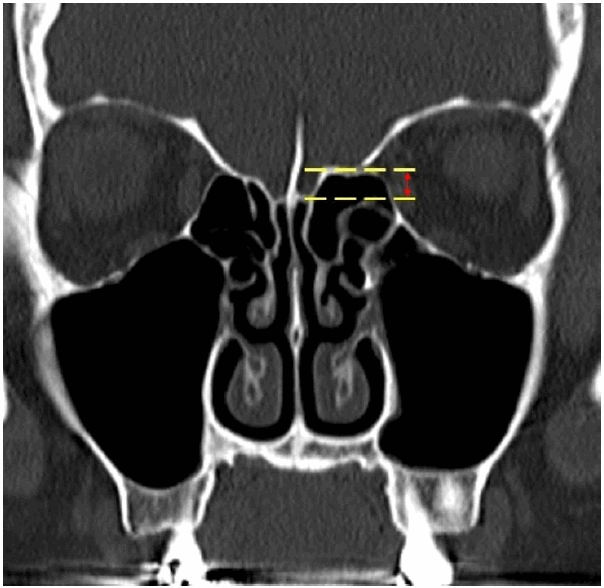
The length of the lateral lamella (double-headed arrow) is measured as the vertical distance between the superior boundary of the fovea ethmoidalis and the horizontal cribriform plate within the olfactory fossa. This measurement is taken on a coronal view of a paranasal Sinus CT scan where the crista galli is clearly visualized.
In the original K classification,1) the depth of the olfactory fossa is classified as type I (1-3 mm), type II (4-7 mm), and type III (8-16 mm). However, this classification system has gaps between categories, such as 3-4 mm and 7-8 mm, which may create ambiguity when classifying actual measured values. This limitation has also been recognized in previous studies by Poteet, et al. [11], Li, et al. [12], and Wang, et al. [13]. These studies applied modified criteria similar to those used in the present study, namely type I, 1-3 mm, type II, 3.1-7 mm, and type III, 7.1 mm or greater. Therefore, the present study applied the same criteria based on these previous studies. Based on the measured LL length, each side was classified as K type I (1-3 mm; low risk), type II (3.1-7.0 mm; intermediate risk), or type III (≥7.1 mm; high risk).
Measurement of AEA location
The location of the AEA, an important risk structure during ESS, was evaluated by measuring the distance between the AEA and the SB, defined as the SB-AEA distance. We referred to the existing three-pattern classification of the AEA as intraosseous course, sulcal course, and mesenteric course [7,11]. Although this three-pattern classification is useful for describing the anatomic course of the AEA in detail, in clinical practice, especially during ESS, the distance of the AEA from the SB is considered more important for assessing the risk of intraoperative injury than the morphologic category itself. Therefore, the AEA was classified into two types in this study. Type 1 was defined as an AEA with an intraosseous or sulcal course that was closely attached to the SB, making vertical distance measurement difficult. Type 2 was defined as an AEA with a mesenteric course that was clearly separated from the SB and allowed vertical distance measurement (Fig. 2).
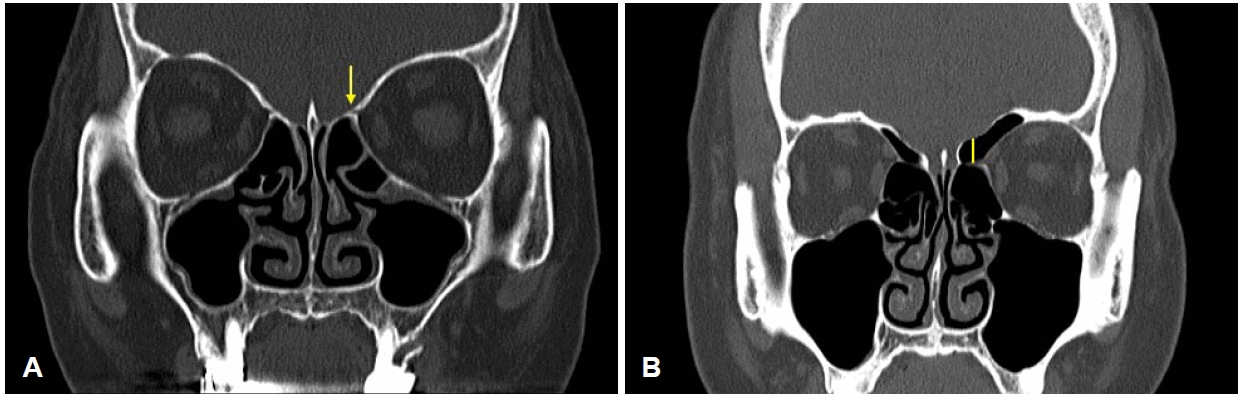
Two types of AEA positions: type 1 (A) and type 2 (B). The AEA-SB distance is measured as the vertical distance between the fovea ethmoidalis and the AEA as seen on a coronal Sinus CT. Arrow: AEA. Vertical line: distance between the fovea ethmoidalis and the AEA. AEA, anterior ethmoidal artery; SB, skull base.
Based on previous studies [12,13], the coronal plane in which the AEA was most clearly visualized at the level of the cribriform plate or fovea ethmoidalis was selected. The vertical distance from the AEA to the horizontal line of the fovea ethmoidalis was then measured (Fig. 2B). For an AEA located at or immediately adjacent to the SB, the distance was recorded as 0 mm.
Statistical analysis
Statistical analyses were performed using SPSS version 24.0 (IBM Corp.). Continuous variables are presented as the mean±standard deviation. The association between K classification and AEA type was evaluated using the chi-square test. Correlations between continuous variables were analyzed using the Pearson correlation coefficient.
Student’s t-test and one-way analysis of variance (ANOVA) were used to compare mean differences between groups. When the ANOVA showed statistical significance, Scheffé post hoc testing was performed for additional between-group comparisons. In addition, to perform stratified analysis of sex-based differences in the SB-AEA distance according to the K classification, mean values between male and female were compared within each K type using an independent-samples t-test. A p-value <0.05 was considered statistically significant in all statistical tests.
To evaluate interobserver and intraobserver reliability, a subset of all CT images was randomly selected. Interobserver reliability was assessed by having two observers independently measure the same images. Intraobserver reliability was assessed by having one of these observers repeat the measurements of the same images after a defined time interval. Reliability was analyzed using the intraclass correlation coefficient (ICC).
Results
Characteristics of the study population and anatomic measurements
A total of 294 patients, including 160 male and 134 female, were analyzed (Table 1). There was no significant difference in age between male (45.6±15.6 years) and female (47.3±16.7 years) (p=0.519).
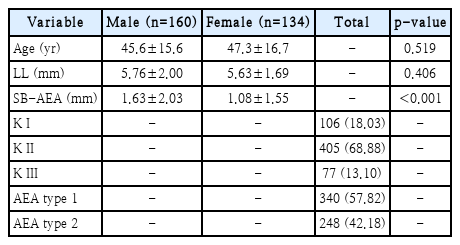
Demographics and anatomical measurements of study population
Among the 588 sides analyzed, the frequencies of K classification were 18.03% (106 sides) for K type I, 68.88% (405 sides) for K type II, and 13.10% (77 sides) for K type III. The AEA location grades were AEA type 1 in 57.82% (340 sides) and AEA type 2 in 42.18% (248 sides).
The mean LL was 5.70±1.87 mm, with a minimum of 1.60 mm and a maximum of 12.10 mm. The mean SB-AEA distance was 1.38±1.84 mm, with a minimum of 0.00 mm and a maximum of 11.53 mm. The LL did not differ significantly between male (5.76±2.00 mm) and female (5.63±1.69 mm) (p=0.406). However, the SB-AEA distance was significantly longer in male (1.63±2.03 mm) than in female (1.08±1.55 mm) (p<0.001).
Associations of K classification with AEA grade and SB-AEA distance
K classification and AEA grade
In K type I, AEA type 1 was observed in 78 sides (13.26%) and AEA type 2 in 28 sides (4.76%). In K type II, AEA type 1 was observed in 244 sides (41.50%) and AEA type 2 in 161 sides (27.38%). In K type III, AEA type 1 was observed in 18 sides (3.06%) and AEA type 2 in 59 sides (10.03%). Overall, a significant association was observed between K classification and AEA grade (p<0.001). In particular, K type III showed a higher proportion of AEA type 2 than the other K types (Table 2).
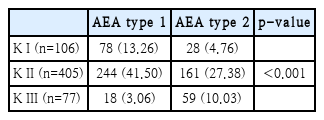
Relationship between K classification and AEA type
SB-AEA distance according to K classification
The mean SB-AEA distance differed significantly according to K classification overall (p<0.001). The mean SB-AEA distance was 0.80±1.45 mm in K type I, 1.27±1.81 mm in K type II, and 2.75±1.86 mm in K type III. Post hoc analysis showed no significant difference between K type I and K type II, whereas K type III differed significantly from both K type I and K type II (p<0.001) (Table 3).
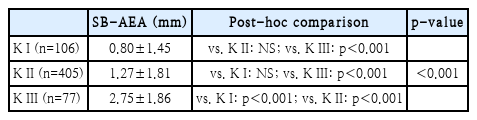
SB-AEA distance according to K classification
Stratified analysis of SB-AEA distance by sex according to K classification
Stratified analysis according to K classification was performed to evaluate sex-based differences in the SB-AEA distance. In the analysis by K type, the SB-AEA distance in K type I was 0.85±1.40 mm in male and 0.75±1.38 mm in female, with no statistically significant difference (p=0.110). In K type II, the SB-AEA distance was 1.45±1.80 mm in male and 1.15±1.75 mm in female, and the SB-AEA distance was significantly greater in male than in female (p=0.008). In K type III, the SB-AEA distance was 2.95±1.95 mm in male and 2.60±1.90 mm in female, with no statistically significant difference (p=0.095) (Table 4).
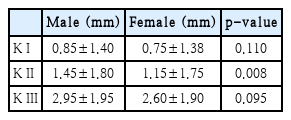
SB–AEA distance according to sex stratified by K classification
Correlations of LL and age with SB-AEA distance
The LL showed a significant positive correlation with the SB-AEA distance (r=0.323, p<0.001). In other words, a longer LL tended to be associated with a lower-lying AEA relative to the SB.
Age showed a significant negative correlation with LL (r=-0.118, p=0.004), although the correlation was very weak. No significant correlation was observed between age and the SB-AEA distance (r=-0.004, p=0.923).
Interobserver and intraobserver reliability analysis
In the reliability analysis, interobserver reliability showed good agreement, with an ICC=0.82. Intraobserver reliability also showed good reproducibility, with an ICC=0.85.
Discussion
This study analyzed the correlations between the K classification and AEA location indicators, including SB-AEA distance and AEA grade. The mean SB-AEA distance in K type III was 2.75±1.86 mm, which was more than twice that in K type I (0.80 mm) and K type II (1.27 mm). This finding indicates that the AEA was located farther below the SB in K type III.
A comparison with previous studies is shown in Table 5. Erwin, et al. [14] reported a mean SB-AEA distance of 2.15 mm, which was somewhat higher than the value of 1.38 mm observed in the present study. In the study by Poteet, et al. [11], the proportion of cases in which the AEA was located below the SB was highest in K type III, at 55%. In the present study, the frequency of AEA type 2 was also significantly higher in K type III (p<0.001), supporting the anatomic vulnerability of K type III. Poteet, et al.11) did not provide the SB-AEA value for K type I, and the corresponding values for K type II and K type III were 3.44 and 4.54 mm, respectively.
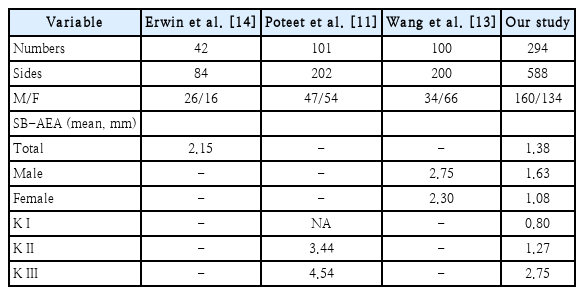
Comparison among previous studies and our study
Our measurements showed some differences from those reported in previous studies. The study by Poteet, et al. [11] and the present study used the same criteria for K classification, namely type I, 1-3 mm, type II, 3.1-7 mm, and type III, 7.1 mm or greater. The same AEA measurement method was also applied. Nevertheless, differences between the present study and previous studies may be related to racial anatomic differences, because Poteet, et al. [11] studied a US population, whereas the present study was conducted in a Korean population. In addition, Poteet, et al. [11] included patients with chronic rhinosinusitis after excluding cases that could affect CT measurements, whereas the present study included both patients with normal CT findings and those with sinonasal abnormalities that did not interfere with radiologic measurements. Therefore, differences in study populations may also have influenced the results. Racial anatomic variation and differences in study populations are considered likely contributors to the differences between the present study and previous studies.
Erwin, et al. [14] did not present a quantitative analysis of SB-AEA distance according to the K classification, and Wang, et al. [13] likewise did not present such an analysis. In contrast, Li, et al. [12] reported that the K classification is a useful indicator for predicting AEA location. The present study also identified sex-related anatomic differences. The SB-AEA distance was 1.63 mm in male and 1.08 mm in female, with a significantly greater value in male (p<0.001). This may be attributable to anatomic characteristics in male, such as a greater SB height or a generally larger ethmoid skeletal framework [16]. These findings are consistent with those of Wang, et al. [13] and Poteet, et al. [11], who reported that male had a greater SB height than female and that the AEA was more likely to be located below the SB in male.
In the analysis of age-related associations, a weak negative correlation was observed between LL and age (r=-0.118), whereas no significant correlation was found between SB-AEA distance and age. Age showed only a weak association with LL length and no significant association with SB-AEA distance.
In the additional stratified analysis according to the K classification, sex-related differences in SB-AEA distance persisted in some K types but were not consistent across all types. These findings suggest that sex-related anatomic differences may partly influence variation in SB-AEA distance. They also indicate that sex should be considered a potential confounding variable in analyses of SB-AEA distance.
A significant positive correlation was observed between LL and SB-AEA distance in this study (r=0.323, p<0.001). A longer LL indicates that the cribriform plate is more deeply depressed relative to the SB, increasing the likelihood of a lower-lying AEA. Therefore, in addition to the K classification, LL length was associated with a more low-lying AEA position and may provide complementary anatomic information during preoperative CT assessment. Abdullah, et al. [2] also emphasized anatomic variations of the AEA in Asian populations, and the present study may provide a basis for predicting AEA location using LL.
A strength of this study is its comprehensive assessment of both qualitative and quantitative indicators, including K classification, LL, SB-AEA distance, and AEA grade, in a relatively large single-institution cohort (n=294, 588 sides). Whereas previous studies relied on a single indicator, the present study may improve clinical risk estimation by using multiple indicators. However, this study also has several limitations. First, because this was a CT-based retrospective study, associations with actual intraoperative exposure and bleeding could not be directly evaluated. Second, because only data from a single institution were used, the anatomic diversity of the entire Korean population may not be represented. Third, because this was a retrospective study conducted at a single institution, the possibility of selection bias cannot be excluded. In addition, sex-related effects could not be fully adjusted for, and future studies should adjust for confounding variables through multivariate analysis. Fourth, because this study was based on CT images collected from July 2017 to December 2018, the imaging data may not fully reflect the current clinical imaging environment. At the time of the study, a 256-slice CT scanner from Siemens Healthineers was used. Currently, various newer systems are being used in clinical practice, including Siemens hybrid and Force CT, Genesis CT from Canon Medical Systems, and Spectral 7500 CT from Philips. Over time, CT equipment user interfaces, image reconstruction algorithms, and image correction technologies have advanced. However, the measurements performed in this study assessed distances and positions between anatomic structures and were performed within the basic principles of CT image acquisition and the range of spatial resolution. Therefore, the influence of technical differences between equipment generations on the interpretation and generalizability of the present results is considered limited.
Based on the results of this study, the authors propose the following practical clinical guidelines. First, at the preoperative evaluation stage, it is essential to recognize the risk of AEA injury in advance and establish preventive strategies. We recommend standardizing the K classification, LL, and SB-AEA distance as checklist items on CT. When the SB-AEA distance is measured as 2 mm or greater, the region should be marked as a high-risk area for the AEA. Second, intraoperative strategies should focus on minimizing the risk of AEA injury in high-risk groups. In high-risk cases or when the surgical field is close to the SB, image-guided surgery (IGS) should be actively used. However, the potential for error in IGS should always be considered, and the expected location of the AEA should be interpreted in relation to surrounding anatomic structures, including the middle turbinate, basal lamella, and SB. Lesions should be removed carefully using short, narrow-tipped instruments. Third, these measurements can be used for postoperative documentation and education. Recording both the K classification and SB-AEA distance in the operative record can provide objective data for analyzing the cause of postoperative complications and can also be used as educational material for surgical training.
Future prospective studies are needed in patients with K type III to measure the SB-AEA distance preoperatively and to analyze its association with actual AEA injury or SB perforation during ESS. In addition, the development of an artificial intelligence-based automatic risk prediction system based on LL and SB-AEA measurements is anticipated. Furthermore, a multivariate analysis including the presence or absence of supraorbital ethmoid cells and various anatomic factors proposed in the International Frontal Sinus Anatomy Classification is needed to establish a predictive model for ESS complications [17,18]. Such studies will further highlight the importance of quantitative evaluation of the anterior ethmoidal canal using CT and 3D reconstruction analysis [19,20].
In conclusion, K classification was significantly associated with AEA type and SB-AEA distance. Preoperative CT assessment of K type, LL length, and SB-AEA distance may improve anatomic risk stratification during ESS.
Supplementary Materials
Korean translation of this article is available with the Online-only Data Supplement at https://doi.org/10.3342/kjorl-hns.2026.00220.
Notes
Acknowledgments
This paper was supported by Wonkwang University in 2026.
Author Contribution
Conceptualization: all authors. Data curation: all authors. Formal analysis: all authors. Methodology: all authors. Writing—original draft: Byoung Jun Kim, Jae Hoon Lee. Writing—review & editing: all authors.