A Physiologically High-Risk Subgroup Within Moderate Obstructive Sleep Apnea
높은 저산소 부담을 동반한 중등도 폐쇄성 수면무호흡증
Article information

Abstract
Background and Objectives
While the apnea-hypopnea index (AHI) is the standard for obstructive sleep apnea (OSA) classification, it only measures event frequency. It fails to account for the duration and depth of desaturation. In contrast, hypoxic burden (HB) addresses this by integrating the area under the nocturnal desaturation curve. This study aimed to characterize patients with moderate AHI who exhibit a disproportionately high HB.
Subjects and Method
This retrospective study analyzed overnight polysomnography data from 319 adults (AHI ≥15 events/h). HB was estimated using an approximated formula (approximated HB, aHB). Patients with moderate OSA were stratified into a moderate-low (ML; aHB <60 %·min/h, n=111) group and a moderate-high (MH; aHB ≥60 %·min/h, n=14) group. A severe subgroup (SS; AHI 30.0-47.7/h, n=98), comprising the lower 50th percentile of severe OSA patients by AHI, served as the comparison group.
Results
Despite similar AHI levels, MH and ML exhibited markedly different aHB (MH 70.3±7.4 %·min/h vs. ML 26.3±12.9 %·min/h; p<0.001). Critically, the aHB of MH was statistically equivalent to that of SS (p=0.401). After adjusting for AHI, age, and body mass index in multivariable regression, neck circumference was not a significant predictor of aHB (β=-0.071, p=0.936).
Conclusion
A subtype of moderate OSA patients with high aHB (≥60 %·min/h) exhibits a nocturnal desaturation profile statistically equivalent to that of early severe OSA, characterized by prolonged apneic events and greater desaturation depth.
Introduction
Obstructive sleep apnea (OSA) is a chronic condition characterized by repetitive upper airway obstruction during sleep, resulting in intermittent hypoxia, sleep fragmentation, and autonomic arousal. OSA is closely associated with cardiovascular disease (CVD), metabolic dysfunction, cognitive impairment, and increased mortality [1,2].
Currently, OSA severity is classified based on the apneahypopnea index (AHI). However, AHI reflects only event frequency and has a fundamental limitation in that it does not capture the qualitative characteristics of individual events—namely, their duration and desaturation depth. As a result, patients with identical AHI values may have substantially different nocturnal hypoxic loads and physiological cardiovascular consequences, and AHI-based classification may underestimate or overestimate actual clinical risk [3,4].
Against this background, hypoxic burden (HB) has emerged as a novel OSA severity metric. HB is calculated as the integrated area under the oxygen desaturation curve across all apnea and hypopnea events.5) Prior studies have demonstrated that HB may provide superior discriminative power over AHI for predicting cardiovascular events, arrhythmia, and mortality [5-8].
In clinical practice, patients with moderate OSA (AHI 15-29 events/h) are often categorized as “moderate” based solely on AHI, which may lead to delayed or de-escalated treatment relative to severe OSA. However, within the moderate OSA range, HB may vary substantially, and a subset of these patients may harbor a physiological burden comparable to that of severe OSA. Early identification of such patients and individualized determination of treatment intensity could represent an important clinical challenge.
The present study aimed to stratify patients with moderate OSA according to approximated HB (aHB) and to characterize the clinical and polysomnographic features.
Subjects and Methods
Study design and participants
This was a retrospective, single-center observational study. Overnight polysomnography (PSG) data were analyzed from adult patients who underwent nocturnal PSG at our institution for sleep-disordered breathing between July 2021 and January 2026. Patients diagnosed with moderate-to-severe OSA (AHI ≥15 events/h) were eligible, and a total of 319 patients were included in the final analysis.
Inclusion criteria were: 1) age ≥18 years; 2) AHI ≥15 events/h on overnight PSG; and 3) total sleep time ≥4 hours. Exclusion criteria were: 1) central sleep apnea index >5 events/h; 2) structural pulmonary disease, including chronic obstructive pulmonary disease; 3) a primary diagnosis of narcolepsy or periodic limb movement disorder; and 4) poor-quality PSG recordings or missing key variables. The study was conducted in accordance with the Declaration of Helsinki and was approved by the Institutional Review Board (IRB) of Eulji Medical Center (IRB No. EMC 2026-02-007).
Polysomnography
Overnight PSG was performed in accordance with the American Academy of Sleep Medicine (AASM) 2012 guidelines. Recorded parameters included electroencephalography (EEG: F3-M2, F4-M1, C3-M2, C4-M1, O1-M2, O2-M1), electrooculography, chin and limb electromyography, electrocardiography, nasal pressure transducer and thermistor for airflow, thoracoabdominal respiratory effort belts, transcutaneous oxygen saturation (SpO2), and body position sensor. All PSG recordings were manually scored by a board-certified sleep physician according to AASM 2012 criteria. Apnea was defined as a ≥90% reduction in airflow from baseline lasting ≥10 seconds; hypopnea was defined as a ≥30% reduction in airflow with an associated ≥3% decrease in SpO2 or an arousal [9].
Calculation of hypoxic burden
An aHB was calculated from standard PSG-derived parameters using the following formula [10]:
aHB (%·min/h) = ½ × ODI × mean event duration (s) × average OD fall (%) / 60.
This formula is a triangular approximation of the desaturation area per respiratory event: each event is modeled as a triangle with base=mean event duration and height=average OD fall, yielding area=½×duration×OD fall per event. Multiplying by oxygen desaturation index (ODI) (events/h) gives the total aHB per hour of sleep. This framework is conceptually grounded in Azarbarzin, et al. [5] and described as a PSG-derived approximation by Parekh [10]. Average OD fall (%) is the mean difference between pre-event baseline SpO2 and event nadir SpO2 across all scored respiratory events. Hereafter, HB derived by this method is termed aHB to distinguish it from raw curve integration-based HB.
Group classification
Of 125 patients with moderate OSA (AHI 15-29.9 events/h), those with aHB <60 %·min/h were classified as the moderate-low risk (ML) group (n=111), and those with aHB ≥60 %·min/h were classified as the moderate-high risk (MH) group (n=14) [11]. The aHB threshold of 60 %·min/h was selected based on the median HB value used in the ISAACC trial post-hoc analysis [7] and prior recommendations from the literature [11]. As a comparator, the lower 50th percentile of patients with severe OSA (AHI ≥30 events/h; AHI range 30.0-47.7 events/h, n=98) was designated as the severe subgroup (SS).
Visualization of severity rank shifts
To assess severity ranking, AHI-based and aHB-based descending ranks (rank 1=most severe) were calculated across the full eligible cohort (n=485; age ≥18 years, total sleep time ≥4 hours, no pulmonary disease), enabling visual comparison of severity rank shifts between the two classification systems.
Statistical analysis
Between-group comparisons of continuous variables were performed using the Kruskal–Wallis test, given the non-normal distribution. Categorical variables were compared using the chi-square test or Fisher’s exact test as appropriate. Significant results were followed by Bonferroni-corrected pairwise comparisons. For small-sample comparisons (particularly ML vs. MH, n=14), Cohen’s d was reported as an effect size measure: |d|<0.2 was interpreted as negligible, 0.2-0.49 as small, 0.5-0.79 as medium, and ≥0.8 as large. Post-hoc power analysis was conducted to estimate statistical power within the current sample. To assess independence of the MH phenotype from potential confounders, multivariable logistic regression was performed (MH=1 vs. ML=0) adjusting for age, body mass index (BMI), neck circumference (NC), AHI, and sex. A sensitivity analysis was conducted across aHB cutoffs of 30, 40, 50, 60, 70, and 80 %·min/h. All analyses were performed at a significance level of p<0.05.
Results
Study population and group classification
Of 125 patients with moderate OSA, 111 were classified as ML and 14 as MH. The SS comparator group comprised 98 patients (AHI 30.0-47.7 events/h). Baseline clinical characteristics did not differ significantly between groups with respect to age, sex, Pittsburgh Sleep Quality Index, Epworth Sleepiness Scale (ESS), diabetes mellitus, CVD, or BMI (Table 1).
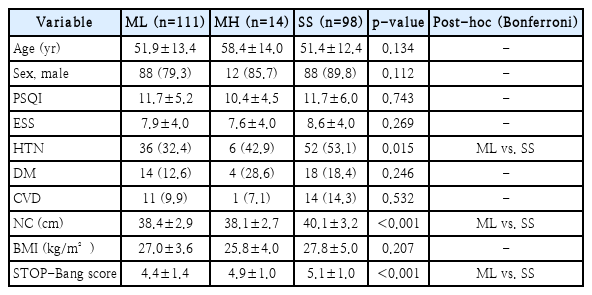
Baseline clinical characteristics by OSA severity group
Although age did not differ significantly between groups (p=0.134), effect size analysis revealed a small effect for MH vs. ML (d=-0.48) and a medium effect for MH vs. SS (d=0.56), indicating a tendency for MH patients to be older than both ML and SS (Table 2). NC was significantly larger in SS than ML (p<0.001), with medium effects observed for both ML vs. SS (d=-0.54) and MH vs. SS (d=-0.62). In contrast, the difference in NC between MH and ML was negligible (d=0.12). The differences in BMI across the groups were small.
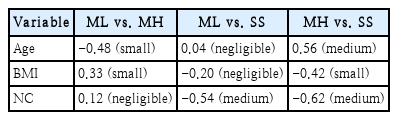
Effect size (Cohen’s d) for anthropometric variables across OSA groups
Multivariable regression analyses
To evaluate whether the MH phenotype is explained by conventional anatomical risk factors, multivariable logistic regression was performed with MH group membership as the dependent variable (MH=1 vs. ML=0), adjusting for age, BMI, NC, AHI, and sex (Table 3). After adjustment, neither NC (odds ratio [OR]=0.971, p=0.869) nor BMI (OR=0.980, p=0.879) was a significant predictor of MH membership, whereas AHI was a significant positive predictor (OR=1.207, p=0.020). In a supplementary multivariable linear regression with continuous aHB as the outcome (Table 4), NC was not a significant predictor (β=-0.071, p=0.936), whereas AHI (β= 1.776, p<0.001) and age (β=0.296, p=0.023) were the only independent predictors (model R²=0.232).
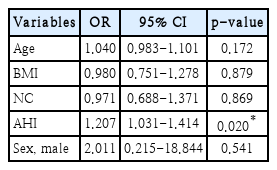
Multivariable logistic regression: predictors of MH group membership
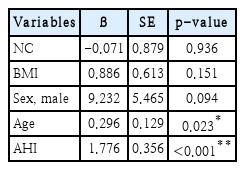
Multivariable linear regression: predictors of continuous aHB (moderate OSA, n=124)
Polysomnographic parameters
Total sleep time (p=0.092), sleep efficiency (p=0.274), wake after sleep onset (p=0.075), and rapid eye movement (REM) sleep proportion (p=0.213) did not differ significantly between groups. AHI differed significantly across all pairs (p<0.001). The apnea index was significantly higher in both MH and SS compared with ML (p<0.001). Notably, the hypopnea index showed an atypical pattern in which MH was lower than ML and markedly lower than SS (p<0.001, all pairs). Supine AHI differed significantly across all three groups (p<0.001, all pairs). Non-rapid eye movement AHI differed significantly between all pairs (p<0.001), whereas REM AHI did not reach significance (p=0.067). Results are shown in Table 5.
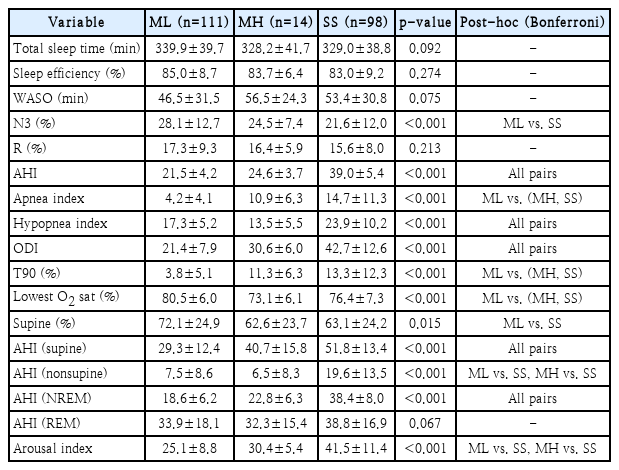
Polysomnographic parameters by OSA severity group
Hypoxic burden
The aHB was 26.3±12.9, 70.3±7.4, and 71.6±52.4 %·min/h in ML, MH, and SS, respectively (p<0.001). There was no statistically significant difference between MH and SS (p=0.401, Bonferroni), whereas MH and ML differed significantly. As a sensitivity analysis, the comparison was extended to all severe OSA patients (n=194; AHI ≥30, mean aHB 120.1± 100.4 %·min/h): MH remained statistically indistinguishable from this broader severe group as well (p=0.364), indicating that the aHB equivalence is robust to the SS definition. The SS lower 50th percentile comparator was retained in the primary analysis to demonstrate that MH patients are equivalent even to the mildest end of severe OSA, providing the most conservative comparison. Decomposition of aHB components revealed that ODI differed significantly across all groups (p<0.001, all pairs). Mean event duration was significantly longer in MH (33.0 s) than in both ML (27.5 s) and SS (28.3 s) (p=0.015). Average OD fall was also significantly greater in MH (8.6%) than SS (6.6%), and greater than ML (5.3%) (p<0.001, all pairs) (Table 6).

aHB components and derived metrics by group
Severity rank shift: AHI vs. aHB
AHI-based and aHB-based severity ranks were calculated across the full eligible cohort (n=319). While most patients clustered near the equal-rank diagonal, all 14 MH patients were consistently displaced above the line, with a mean rank shift of 116 positions (range: 77-186), compared with a mean shift of -5.6 positions among all other patients (Mann–Whitney p<0.001). By AHI rank, MH patients occupied positions 195-319 (lower 61%-100% of the cohort by severity); by aHB rank, they shifted to positions 93-137 (upper 29%-43% of the cohort). This systematic displacement demonstrates that patients classified as moderate by AHI alone may harbor a HB placing them among the most severely affected patients when assessed by aHB (Fig. 1).
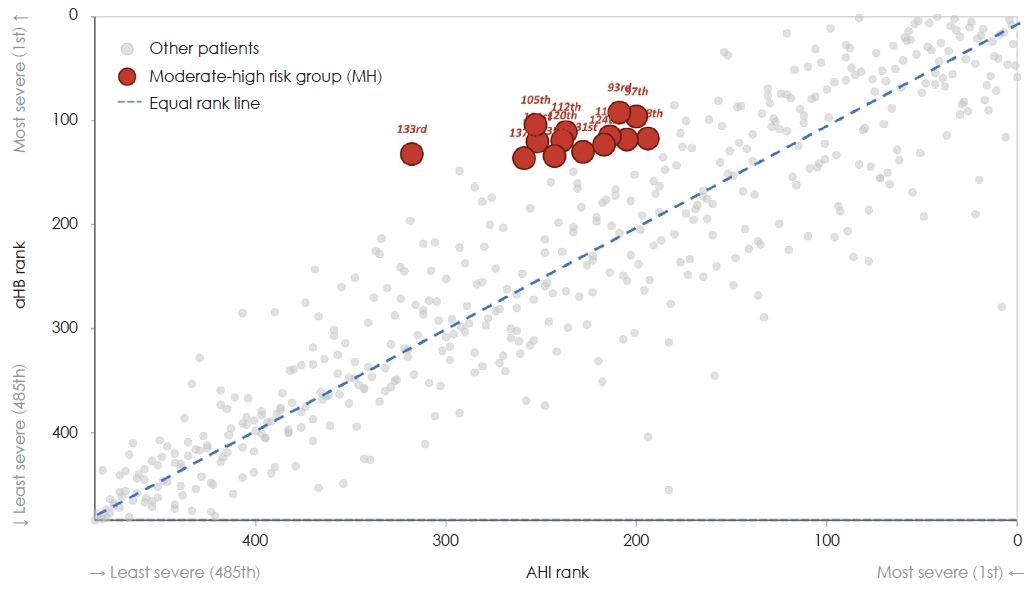
Shift in severity ranking: apnea-hypopnea index (AHI) vs. approximated hypoxic burden (aHB). AHI rank: 1st=most severe by event frequency; aHB rank: 1st=most severe by hypoxic load. Equal rank line=indicates where AHI rank and aHB rank are identical. MH, moderate-high.
Discussion
The present study identified a subset of patients with moderate OSA by AHI (MH group; aHB ≥60 %·min/h) who demonstrated a nocturnal HB statistically equivalent to that of early-severe OSA (SS), constituting a physiologically high-risk subgroup within moderate OSA. Two principal findings emerged. First, the elevated aHB in MH was attributable not to event frequency alone—ODI in MH (30.6/h) was intermediate between ML (21.4/h) and SS (42.7/h)—but to prolonged event duration (33.0 s vs. 27.5 s in ML; p=0.001, Cohen’s d=1.05) and greater desaturation depth (OD fall 8.6% vs. 5.3%; p<0.001, Cohen’s d=2.40), both independent of event frequency. Second, after adjusting for AHI, age, BMI, NC, and sex in multivariable analysis (Tables 3 and 4), neither NC nor BMI was a significant predictor of MH membership, whereas AHI within the moderate range was the only significant anthropometric predictor, indicating that this physiological phenotype is not driven by anatomical airway narrowing.
AHI has long served as the standard for OSA severity classification; however, its fundamental limitation—capturing only event frequency while disregarding event duration and desaturation depth—has been repeatedly highlighted [3,4]. The rank-shift analysis (Fig. 1) provides a descriptive visual illustration of this limitation at the individual patient level; it is not an inferential statistical test. The systematic displacement of MH patients above the equal-rank diagonal reflects the presence of a distinct physiological mechanism underlying AHI-aHB discordance and is presented as hypothesis-generating rather than confirmatory.
Prior large-cohort studies have demonstrated the prognostic superiority of HB over AHI. Azarbarzin, et al. [5] first demonstrated in the MrOS and SHHS cohorts that HB outperformed AHI in predicting cardiovascular mortality. Azarbarzin, et al. [6] reported an independent association between HB and incident heart failure, whereas AHI was not significant in the same models. Peker, et al. [7] used the cohort median (60.7 %·min/h) as an HB threshold in the RICCADSA cohort and demonstrated a significantly higher incidence of major adverse cardiac and cerebrovascular events in the high-HB group, with continuous positive airway pressure (CPAP) showing a protective effect selectively in this group. Trzepizur, et al. [8] confirmed an independent association between HB and cardiovascular mortality in the SHHS cohort. Collectively, these studies converge on an HB threshold of approximately 60 %·min/h as clinically meaningful, consistent with the cutoff used in the present study.
Decomposition of the aHB components revealed that the elevated aHB in MH originated from qualitative event characteristics rather than event frequency. Although ODI in MH (30.6/h) was intermediate between ML (21.4/h) and SS (42.7/h), aHB in MH equaled that of SS owing to longer event duration and greater OD fall per event. It should be acknowledged that mean event duration and OD fall are mathematical components of the aHB formula itself; their contribution to aHB is therefore partly definitional rather than fully independent. The physiologically distinct finding lies in the combination: despite having far fewer events per hour than SS (ODI 30.6/h vs. 42.7/h), MH achieves equivalent total hypoxic load through substantially longer (33.0 s vs. 28.3 s, p=0.005) and deeper (OD fall 8.6% vs. 6.6%, p<0.001) desaturation per event, indicating qualitatively different apneic physiology. This finding is consistent with prior reports that apneic events are associated with greater desaturation magnitude than hypopneas,12) and that apnea predominance reflects more complete upper airway obstruction.
The predominance of complete apnea over hypopnea in MH provides an additional mechanistic explanation. Complete upper airway obstruction is associated with deeper desaturation and longer event duration relative to partial obstruction (hypopnea), thereby amplifying both the duration and depth components of HB.
A notable feature of the MH subgroup is that its elevated aHB is not explained by conventional anatomical risk factors for OSA (Tables 3 and 4). After adjusting for AHI, age, BMI, NC, and sex, NC was not a significant predictor of MH group membership (OR=0.971, p=0.869), nor was BMI (OR=0.980, p=0.879). In a multivariable linear regression with continuous aHB as the outcome, NC remained non-significant (β=-0.071, p=0.936), whereas AHI (β=1.776, p<0.001) and age (β=0.296, p=0.023) were the only independent predictors. The AHI-independent determinants of aHB were mean event duration (partial r=0.461, p<0.001) and average OD fall (partial r=0.861, p<0.001), suggesting that aHB elevation in MH reflects qualitative event characteristics rather than anatomical airway burden. These data suggest, though cannot confirm, that physiological factors such as age-related decline in pharyngeal muscle tone and attenuated arousal responses during sleep [13] may prolong apneic events and deepen desaturation even in the absence of overt obesity.
The bidirectional nature of AHI-aHB discordance also warrants attention. Among the 194 severe OSA patients in this cohort, 66 (34.0%) had aHB below 60 %·min/h despite meeting AHI criteria for severe OSA (AHI 42.1±11.9/h)—constituting a potential “hidden non-severe” counterpart phenotype. These patients showed comparatively more favorable nocturnal oxygenation profiles (nadir SpO2 79.6%±6.0%, T90% 8.7%±11.0%) than the severe-high-HB subgroup (nadir SpO2 68.4%±9.0%, T90% 32.3%±21.7%; both p<0.001), suggesting that even within AHI-defined severe OSA, aHB adds prognostic stratification. Taken together with the MH findings, these data support the concept that AHI and aHB each capture partially non-overlapping dimensions of OSA severity, and that routine aHB estimation may provide clinically meaningful stratification beyond AHI alone. Prospective studies examining clinical outcomes in both discordant phenotypes are warranted.
Pinilla, et al. [14] reported, in a post-hoc analysis of the ISAACC trial, that the cardiovascular protective effect of CPAP was selectively observed in patients with high baseline HB (median 60.7 %·min/h), suggesting that HB may serve as a predictive biomarker for CPAP benefit. Martinez-Garcia, et al. [11] proposed HB >60 %·min/h as a threshold for predicting improvement in ESS scores following CPAP therapy. Taken together, these prior findings support the clinical validity of HB ≥60 %·min/h as an identification criterion for the high-risk MH phenotype.
Several limitations of this study should be acknowledged. First, as a single-center retrospective study, selection bias cannot be excluded, and patients attending a sleep clinic may differ from the general population, limiting external validity. Second, the MH group comprised only 14 patients, reflecting the rarity of this phenotype (11.2% of moderate OSA). Post-hoc power analysis confirmed adequate power for the primary comparisons (aHB: Cohen’s d=3.54, power >0.999; apnea index: Cohen’s d=1.53, power >0.999; mean event duration: Cohen’s d=1.05, power=0.960) and should be interpreted as a directional trend. Third, aHB was derived from a triangular approximation of the desaturation area rather than direct integration of raw SpO2 time-series data. Although this approach has strong construct validity (r with T90%=0.648; r with nadir SpO2=-0.580; both p<0.001), it is a systematic underestimate of true HB and requires direct validation against raw curve integration in future studies. Fourth, the 60 %·min/h threshold was adopted from Western cohorts; a sensitivity analysis across cutoffs 30-80 %·min/h confirmed robustness, but ethnic-specific validation is warranted. Fifth, this is a cross-sectional study without longitudinal cardiovascular outcome data; physiological equivalence of MH and SS in terms of aHB does not establish prognostic equivalence, and prospective studies are required.
Notes
Acknowledgments
None
Data Availability
The datasets generated and/or analyzed during the current study are available from the corresponding author upon reasonable request.
Author Contribution
Data curation: Myoung Su Choi, Jong Kwan Kim. Formal analysis: Myoung Su Choi. Methodology: Jong Kwan Kim. Writing—original draft: Myoung Su Choi, Jong Kwan Kim. Writing—review & editing: Myoung Su Choi.